

TL;DR:
Microsoft Fabric doesn’t work like a simple “per-user licence”. Instead, you buy a capacity (a pool of compute called Capacity Units, or CUs) and share that across all resources (lakehouses, SQL servers, Notebooks, pipelienes, Power BI reports etc.) you use inside fabric for (data engineering, warehousing, dashboards, analytics). On the top of this, you separately pay for storage and certain user licences if you publish dashboards. The smart path: start small, track your actual consumption, align capacity size and purchasing model (pay-as-you-go vs reserved) with your usage pattern, so it becomes cost-efficient rather than a budget surprise.
What makes Fabric’s pricing model different
If you’re used to licencing models for analytics tools such as per-user dashboards or pay-per-app, Fabric introduces a different mindset. It’s no wonder many teams are confused and asking questions like:
“Will moving our Power BI set-up into Fabric make our costs spiral?”
“We’re licensing for many users. Do we now have to keep paying per user and capacity?”
“What happens when our workloads spike? Will we pay through the roof?”
Reddit users already ask:
“Can someone explain me the pricing model of Microsoft Fabric? It is very complicated …”
So yes, it’s new, it’s different, and you should understand the mechanics before you start using it.
This is the fourth part of our series on Microsoft Fabric. Read more about
- How Fabric changes enterprise data and AI projects
- When to start using Fabric, and
- How to set up your first Fabric workplace
The basics: what you must understand
Here are the key building blocks:
Availability of capacity = compute pool
Fabric uses “capacity” measured in CUs (Capacity Units). For example, an “F2” capacity gives you 2 CUs, “F4” gives 4 CUs, and so on up to F2048.
That pool is shared by all workloads in Fabric: data flows, notebooks, lakehouses, warehousing, and dashboards.
Important: you’re not buying a licence per user for most functionality, you’re buying compute capacity. It’s also important to note that if you are usign a Pay-as-You-Go model you’ll pay whenever the capacity is turned on (whether you are actively using it or not). You’ll be billed based on the time (minutes) the capacity was running and it doesn't matter if you were using all or none of your CU-s.
Storage is separate
Storage (via OneLake) is billed separately per GB. The capacity you buy doesn’t include unlimited free storage.
There are additional rules e.g. free mirroring storage allowances depending on capacity tier.
User licences still matter, especially for dashboard publishing
If you use Fabric and you want to publish and share dashboards via Power BI, you’ll still need individual licences (for authors/publishers) and in certain cases viewers may need licences depending on capacity size.
So compute + storage + user licences = the full picture.
Purchasing models: pay-as-you-go (PAYG) vs reserved
- Pay-as-you-go: You pay for the capacity per hour (minimum one minute) as you run it, and you can scale up/down. Good if usage is variable.
- Reserved capacity: You commit to a capacity size for a year (or more) and get ~40% discount—but you pay whether it’s used or not. Good if your workloads are steady.
How to pick the right model and avoid common mistakes
1. Track your workload and consumption before committing
Because you’re buying a pool of compute rather than per-user seats, you need to know how many jobs, how many users, how many refreshes, how much concurrency you’ll have.
For example: if you pick a small capacity and your workloads goes beyond that, Fabric may apply “smoothing” or throttle. So start with PAYG or small capacity, track consumption for 60-90 days.
2. Ask the right questions up front
- “Will our usage spike at month-end or quarters?”
- “How many users are viewing dashboards vs authoring?”
- “How many data transformation jobs run concurrently?”
- “Can we pause capacity on nights/weekends or non-business hours?”
If you don’t answer these, you risk buying too much (wasted spend) or too little (performance issues).
3. Beware the “viewer licence” threshold
There’s a key capacity size (F64) where things change: For capacities below F64, users may still need separate Power BI PRO licences for report or dashbaord consumption; at F64 and above, viewers may not need individual licences.
If you migrate from an older Power BI model into Fabric without checking this, you could pay more.
4. Storage charges can sneak in
Large datasets, duplicates, backup snapshots, and deleted workspaces (retention periods) all consume storage. Storage costs may be modest ($0.023 per GB/month as of November 2025) compared to compute, but with volumes they matter.
Also, networking fees (data transfer) are “coming soon” as a Fabric cost item.
5. Don’t treat capacity like a fixed server
Because Fabric allows bursting (temporarily going above your base capacity) and smoothing (spreading load) your cost isn’t purely linear with peak loads. But you still pay for what you consume, so design workloads with efficiency in mind (incremental refresh, partitioning, avoiding waste).
A simplified checklist for your team
- Audit actual workloads: data jobs, refreshes, user views.
- Choose initial capacity size: pick a modest SKU (F4, F8) for pilot.
- For smaller solutions (below F64) it might make sense to combine Fabric PAYG and Power BI PRO solutions to get the best performance and price.
- Run PAYG for 60-90 days: monitor CUs used, storage, spikes.
- Analyse when you hit steady-state usage (>60% utilisation) → consider reserved capacity.
- Map user roles: who authors dashboards (needs Pro/PPU licence), who views only (maybe Free licence depending on capacity).
- Optimise data architecture: incremental loads, partitioning, reuse instead of duplication.
- Monitor monthly: CUs consumed, storage growth, unused capacity, aborted jobs.
- Align purchase: Scale up/down capacity ahead of known events (e.g., month-end), pause non-prod when idle.
Frequently-asked questions
“Will moving our Power BI setup into Fabric make our costs spiral?”
Not necessarily — if you migrate smartly. If you move without revisiting capacity size/user licences you could pay more, but if you use this as an opportunity to right-size, share compute across workloads, optimise refreshes and storage, you might actually get better value.
“Do I need a user licence for every viewer now?”
It depends on your capacity size. If your capacity is below certain thresholds, viewers may still need licences. At F64+ capacities you may allow free viewers for published dashboards. Monitor your scenario.
“What happens if we only run analytics at month-end? Can we scale down otherwise?”
Yes, with PAYG you can scale down or pause capacity when idle, hence paying only when needed. With reserved you lock in purchase. Choose based on your workload patterns.
“Is storage included in capacity cost?”
No, storage is separate. You’ll pay for OneLake storage and other persistent data. If you have massive data volumes, this needs budgeting
Get Fabric licensing right from the start
While Microsoft Fabric’s licensing and pricing model may feel unfamiliar compared to traditional per-user or per-service models, it offers substantial flexibility and potential cost-efficiency if you approach it intentionally. Buy capacity, manage storage, plan user licences, and do the tracking in the early phase.
Teams that treat this as an after-thought often get surprised by bills or performance constraints. Teams that design for efficiency from the start get a shared analytics and data-engineering platform that truly scales.
Licensing clarity is the first step to a smooth Fabric journey.
Our experts can assess your current environment, model different licensing scenarios, and build a right-sized plan that keeps costs predictable as you scale.
TL;DR
Use our step-by-step guide to start using Fabric safely and cost-effectively, from setting up your first workspace and trial capacity to choosing the right entry path for your organisation. Build a lakehouse, connect data, create Delta tables, and expand gradually with pipelines, Dataflows, and Power BI. Whether you’re starting from scratch or integrating existing systems, it shows how to explore, validate, and adopt Fabric in a structured, low-risk way.
How to start using Fabric safely and cost-effectively
Before committing to a full rollout, start small. Activate a Fabric trial or set up a pay-as-you-go capacity at a low tier (F2–F8). These are cost-effective ways to explore real workloads and governance models without long-term commitments.
Begin by creating a workspace. From here, you can take one of two paths: starting fresh or integrating with what you already have.
1. Starting fresh (greenfield)
If you don’t yet have a mature data warehouse or analytics layer, Fabric lets you build the essentials quickly with minimal infrastructure overhead.
You can:
- Create a lakehouse in your workspace
Import sample data (e.g.: ready to use Contoso data) or upload Excel/CSV files
- Explore them with SQL or notebooks
This gives you a safe sandbox to understand how Fabric’s components interact and how data flows between them.
2. Integrating with what you already have
Most organisations already have data systems — SQL databases, BI tools, pipelines, or on-prem storage. Keep what works; Fabric can extend it.
You can:
- Use Dataflows Gen2 or pipelines to ingest and transform data from existing sources
- Create OneLake shortcuts to reference external storage
- Bring in exports or snapshots (for example, CRM tables or logs)
- Use Fabric as an analytical or orchestration layer on top of your current systems
This hybrid approach lets you test Fabric on real data without disrupting production systems, helping you identify where it delivers the most value before scaling further.
Next steps once you’re up and running
After choosing your entry path, expand iteratively. Fabric rewards structure, not speed.
Add ingestion and transformation
Continue shaping data with Notebooks, Dataflows Gen2 or pipelines, schedule refreshes, and test incremental updates to validate performance.
Expose for analysis
Create a warehouse or semantic model, connect Power BI, and check performance, permissions, and security. Involve your Power BI administrators early — Fabric changes how capacities, roles, and governance interact.
Introduce real-time scenarios
Connect streaming sources, create real-time tables or queries, and trigger alerts or automated actions using activators.
Advance to AI and custom workloads
Train and score models in notebooks, or use the Extensibility Toolkit to build custom solutions integrated with pipelines.
Govern, monitor, and iterate
Apply governance policies, monitor cost and performance, and use CI/CD with Git integration to manage promotion across environments and maintain auditability.
Core Fabric building blocks and how to use them
Lakehouses & delta tables
Lakehouses in Fabric combine data lake flexibility with analytic consistency. Under the hood, Fabric stores everything in Delta Lake tables, which handle updates and changes reliably without breaking data consistency.
You can ingest raw files into lakehouse storage, define structured tables, and then query them with SQL or Spark notebooks. Use delta features to handle changes and versioning.
Pipelines & Dataflows
Fabric includes pipeline orchestration similar to Azure Data Factory. Use pipelines (copy, transformation, scheduled) for heavier ETL/ELT workloads.
Use Dataflows Gen2 (Power Query–style) for lighter transformations or data prep steps. These can be embedded or called from pipelines.
If you prefer a pro-code/code-first solution you can use PySpark, SparkSQL or even a simple python code to transform and analyse your data in a Notebook.
Together, they let you build end-to-end ingestion workflows, from source systems into lakehouses or warehouses.
Warehouses & SQL query layer
Once data is structured, you may want to provide a SQL query surface. Fabric lets you spin up analytical warehouses (relational, MPP) to serve reporting workloads.
These warehouses can sit atop the same data in your lakehouse, leveraging delta storage and ensuring you don’t duplicate data.
Real-time intelligence
One of Fabric’s differentiators is built-in support for streaming and event-based patterns. You can ingest event streams, process them, store them in real-time tables, run KQL queries, and combine them with historical datasets.
You can also define activators or automated rules to trigger actions based on data changes (e.g. alerts, downstream writes).
Data science & AI
Fabric includes native support for notebooks, experiments (MLflow), model training, and scoring. You can ingest data from the lakehouse, run Python/Spark in notebooks, train models, register them, and score them at scale.
Because the same storage underlies all workloads, you don’t need to copy data between ETL, analytics, and AI layers.
Extensibility & workloads
For development teams or ISVs, Fabric supports custom workload items, manifest definitions, and a DevGateway. Microsoft provides a Starter-Kit that helps you scaffold a "HelloWorld" workload to test in your environment.
You can fork the repository, run local dev environments, enable Fabric developer mode, and build custom apps or tools that operate within Fabric’s UI.
Common scenarios and example workflows
Speeding up Power BI reports
Move slow or complex dataflows into a lakehouse, define delta tables, and connect Power BI directly for faster, incremental refreshes.
Real-time monitoring
Ingest IoT or application logs into real-time tables, run KQL queries to detect anomalies, and trigger automated alerts or actions as events occur.
Predictive analytics
Use lakehouse data to train and score models in notebooks, then surface results in Power BI for churn, demand, or risk forecasting — all within Fabric.
Custom extensions
Build domain-specific tools or visuals with the Extensibility toolkit and integrate them directly into Fabric’s workspace experience.
Best practices and things to watch out for
Data discipline matters — naming, ownership, and refresh planning remain essential. Start small and build confidence. Begin with one or two use cases before expanding.
Treat migration as iterative; don’t aim to move everything at once. Sync with your BI and governance teams early, as changes in permission and capacity models affect all users.
Use Microsoft’s Get started with Microsoft Fabric training. It walks you through each module step by step. And take advantage of the end-to-end tutorials covering ingestion, real-time, warehouse, and data science flows.
Fabric delivers the most value when aligned with your goals. Our team can help you plan, pilot, and scale it effectively — get in touch to get started.
This is the third part of our series on Microsoft Fabric. Read more about
- How Fabric changes enterprise data and AI projects
- When to start using Fabric, and
- The basics of Fabric licensing
Resources:
https://learn.microsoft.com/en-us/training/paths/get-started-fabric/

TL;DR
Fabric is emerging as the next-generation data and AI platform in Microsoft’s ecosystem. For growing organisations, the real question isn’t if you’ll use it — it’s how to get ready so that the investment delivers value fast. Signs you’re ready to begin: if your reporting relies on too many Excel files, your Power BI dashboards are slowing down, or pulling consistent data from different tools has become time-consuming and expensive. It’s also time to explore Fabric if your infrastructure and maintenance costs keep rising while insights stay stuck in silos.
“Where should we begin if we’re new to Microsoft Fabric?”
Whether you’re at the start of your analytics journey or already running tools like Synapse, Databricks, or Data Factory, Fabric offers a unified, scalable platform that connects your data and prepares you for AI. Not every organisation will start from the same place, and that’s okay.
Start small. Use a trial or low-tier capacity, connect one key dataset, define clear goals of your POC and evaluate performance. Hold off only if your organisation lacks data discipline or governance maturity. The earlier you begin experimenting, the smoother your transition when Fabric becomes the foundation of enterprise data operations.
This is the second part of our series on Microsoft Fabric. Read more about
- How Fabric changes enterprise data and AI projects
- How to set up your first Fabric workplace, and
- The basics of Fabric licensing
“Can Fabric live up to its ‘all-in-one’ claims? Is now the right time to jump in?”
It’s a question many teams are asking as Microsoft pushes Fabric into mainstream adoption.
You’ve seen the demos, read the roadmap, and perhaps even clicked that ‘Try Fabric’ button — but readiness is key.
If you adopt it before your organisation is prepared, you’ll spend more time experimenting than gaining value. If you start using it too late, your competitors will already be using Fabric to run faster, cleaner, and more scalable data operations.
Why timing matters for Microsoft Fabric adoption
If your team already uses Microsoft 365, Power BI, or Azure SQL, Fabric is the natural next step. It brings all your data and analytics together in one secure, cloud-based platform, without adding another layer of complexity.
For many organisations, the real challenge isn’t collecting data — it’s connecting it. You might be pulling financials from SAP or Dynamics, customer data from an on-premises CRM, and operational data from a legacy ERP or manufacturing system. Each of those tools stores valuable information, but they rarely talk to each other in real time.
Fabric bridges that gap by creating a single, governed layer where all your data can live, be analysed, and feed AI models, while still integrating smoothly with your existing Microsoft environment. It brings together what used to be separate worlds:
- Synapse for warehousing,
- Data Factory for pipelines,
- Stream Analytics for real-time data, and
- Power BI for reporting.
Historically, these ran as siloed services with their own governance and performance quirks.
Fabric replaces this patchwork with one SaaS platform, powered by OneLake as a shared data foundation. That means one copy of data, one security model, and one operational playbook. Less time reconciling permissions, fewer brittle integrations, and a unified line of sight on performance.
For IT Operations, this changes everything. Instead of maintaining scattered systems, teams move towards proactive enablement, governance, monitoring, and automation.
The real challenge isn’t understanding what Fabric can do; it’s knowing when your environment and team are ready to make the move.
Questions like this keep surfacing across forums like Reddit:
“Do we actually have the right skills and governance in place to use Microsoft Fabric properly?”
Let’s see what readiness really looks like in practice.
Signs your organisation is ready for Microsoft Fabric
You don’t need a massive data team or an AI department to benefit from Fabric. What matters is recognising the early warning signs that your current setup is holding your business back.
You’re running the business from Excel (and everyone’s version is different)
If every department builds its own reports, and the CEO, finance, and sales teams are never looking at the same numbers, Fabric can unify your data sources so everyone works from one truth.
Your Power BI reports are slowing down or getting hard to maintain
When dashboards take too long to refresh or adding new data breaks existing reports, you’ve outgrown your current setup. Fabric helps you scale Power BI while keeping performance and governance under control.
Reporting takes days and still raises more questions than answers
If your analysts spend more time moving files than analysing data, you’re ready for a platform that automates data movement and standardises reporting.
Your IT costs are rising, but you’re still not getting better insights
Maintaining servers, SQL databases, or patchwork integrations adds cost without adding value. Fabric replaces multiple systems with one managed platform, reducing overhead while enabling modern analytics and AI.
You want to use AI responsibly, but don’t know where to start
Fabric integrates Microsoft’s Copilot and data governance tools natively. That means you can explore AI safely — with your data, under your security policies — and our team can help you get there, step by step.
When to wait before adopting Microsoft Fabric
There are good reasons to hold off, too. If your organisation still lacks basic data discipline — no clear ownership, inconsistent naming, or ungoverned refreshes — Fabric will only amplify those gaps. Similarly, if you rely heavily on on-premises systems that can’t yet integrate with Fabric, the return on investment will be limited.
And if your team has no Fabric champions or time for upskilling, start with a pilot. Microsoft’s learning paths and community are growing by the day, but this is a platform that rewards patience and structure, not a rush to go all-in at once.
Even if you’re not ready today, you can start preparing by defining who owns your key datasets, documenting where your data lives, and assigning a small internal champion for analytics.
These are the first building blocks for a successful Fabric journey — and we can help you set them up before you invest in the platform itself.
Put real-time intelligence and AI agents to work
Once you’ve built a foundation of data discipline and readiness, Fabric starts to show its real power.
Fabric enables real-time visibility into your operations, whether that means tracking inventory levels, monitoring production metrics, or getting alerts when something in your system changes unexpectedly. Instead of waiting for a daily report, you can see what’s happening as it happens.
And AI capabilities go far beyond Copilot. Fabric introduces data agents: role-aware assistants that enable business users to explore and query data safely, without adding reporting overhead for IT. The result is true self-service intelligence, where operations teams can focus on governance, performance, and optimisation instead of ad-hoc report requests.
Start before you need it, but not before you’re ready
Teams that start experimenting with Fabric now will be the ones setting best practices later. Microsoft’s development pace is relentless, and Fabric’s roadmap is closing the gaps between data, analytics, and AI at speed.
Fabric adoption isn’t a switch-on event. It comes with a learning curve. The earlier you begin, the easier it becomes to standardise governance, establish naming conventions, and embed Fabric into CI/CD and monitoring pipelines.
If your analytics stack feels stretched, your infrastructure spend is rising, or your governance model needs a reset, it’s time to start testing Fabric. Do it deliberately, in small steps, and you’ll enter the next generation of Microsoft’s data platform on your own terms.
Ready to see how Microsoft Fabric could work for your organisation?
Whether you’re just exploring or planning a full modernisation, our team can help you map your current data landscape and guide you step-by-step through a safe, structured adoption.
Book a free Fabric readiness assessment.

TL;DR
You don’t always need Copilot Studio to use Copilot in Power Platform. Microsoft is weaving generative features directly into tools like Power Apps and Power Automate. With generative pages, you can use natural language to build pages into your model-driven apps with unique functionality, skipping dozens of manual steps. It’s still early days but it already shows how Copilot is moving from optional add-on to everyday productivity layer inside the platform.
Ever wished Copilot could build your Power Platform pages for you?
Model-driven apps have always been structured and corporate, designed for consistency rather than flexibility. Custom pages (similarly to canvas apps) gave makers some creative freedom but building them often meant lengthy workarounds.
Generative pages change that balance. You can now describe what you need in plain English, and Copilot generates the page for you inside your model-driven app. What once required dozens of steps or complex canvas app design can now be spun up in minutes.
This is more than a convenience feature. It marks the way Copilot is flowing into the Power Platform ecosystem — not as a knowledge base lookup tool, but as a practical, embedded capability for app creation.
How to build your first app with Copilot in Power Platform
If you want to explore generative pages today, you’ll need to set up a US developer environment. The preview was announced on 21 July and, at the time of writing, is only available in the United States.
European users can experiment by creating a US environment, but they should only use data that is safe to leave EU boundaries. A full general availability release in Europe is expected in 2026, though dates are not yet confirmed in Microsoft’s release plans.
How to get started:
- Start with a model-driven app (see Microsoft’s step-by-step guide). Generative pages sit inside these apps, giving you a natural language way to add new functionality.
- Describe what you need in plain language — for example, “a form to capture customer onboarding details” or “a dashboard showing open cases by priority.” Copilot generates the layout, controls, and data bindings automatically.
- Refine and customise the page by adjusting fields, tweaking the layout, or modifying logic as you would with any other app component.
- Embed the page into your app by adding it to navigation, combining it with existing model-driven pages.
Think of the PCF as the “3D printer” for your LEGO set. Power Platform already gives you plenty of building blocks (low-code components you can drag and drop). If something is missing, PCF lets you design and build your own bespoke block, then slot it neatly into your app.
- Start using it. The output isn’t a mock-up or placeholder; it’s a functional page connected to your data model and ready to support your process.
Copilot for Power Automate
Copilot isn’t only helping with app building. In Power Automate, you can now create flows just by describing what you want in plain English.
Instead of adding every step manually, Copilot builds the flow for you. This makes it easier for newcomers to get started and saves time for experienced makers. You can find examples and details on Microsoft Learn.
What to keep in mind
- Early wave: These features are still in preview. Expect limitations, and don’t base production apps on them yet.
- Data residency: If you’re in Europe and experimenting with a US environment, only use non-sensitive data.
- Future availability: European general availability is expected in 2026, but plans are not final. Check the release plan site for updates.
- Governance still matters: Copilot may reduce effort, but it doesn’t remove the need for data quality, licensing checks, and proper lifecycle management.
What’s next in AI-assisted app design
We’re still at the start of the wave, but even now, you can create polished, functional applications in a fraction of the time and embed them directly into model-driven apps. Copilot will soon become part of everyday app-building in the Power Platform — no separate studio required.
Copilot isn’t just about generating text. It makes us rethink how enterprise applications are designed and automated. And as these previews mature into general availability, the difference between long, complex builds and quick, AI-assisted development will only widen.
Curious how to adopt Copilot in your Power Platform environment today and prepare for what’s coming next? Get in touch with our experts and start shaping your roadmap.
TL;DR
Copilot Studio makes it possible for IT Ops and business teams to create custom AI agents that can answer questions, run processes, and even automate workflows across Microsoft 365. We recommend a structured approach: define the use case, create the agent, set knowledge sources, add tools and actions, then shape its topics and triggers. But before you start building, check your data quality, define a clear purpose, and configure the right policies.
Before you start setting anything up, pause
It’s tempting to open Copilot Studio and start dragging in tools, uploading files, and typing instructions. But an agent without a plan is just noise.
- Get your data in order first. Bad data means bad answers, and no amount of clever configuration can save it.
- Define the “why” before the “how.” Build around a specific use case. For example, sales support, finance queries, service troubleshooting.
- Don’t build for the sake of building. Just because you can spin up a chatbot doesn’t mean you should. The best agents are purposeful, not experimental toys.
Think of your agent as a new team member. Would you hire someone without a role description? Exactly.
Building your first Copilot: practical steps
Once you know the “why”, here’s how to get your first custom agent working:
1. Author clear instructions
Clear instructions are the foundation of your agent. Keep them simple, unambiguous, and aligned to the tools and data you’ve connected. Microsoft even provides guidance on how to write effective instructions.
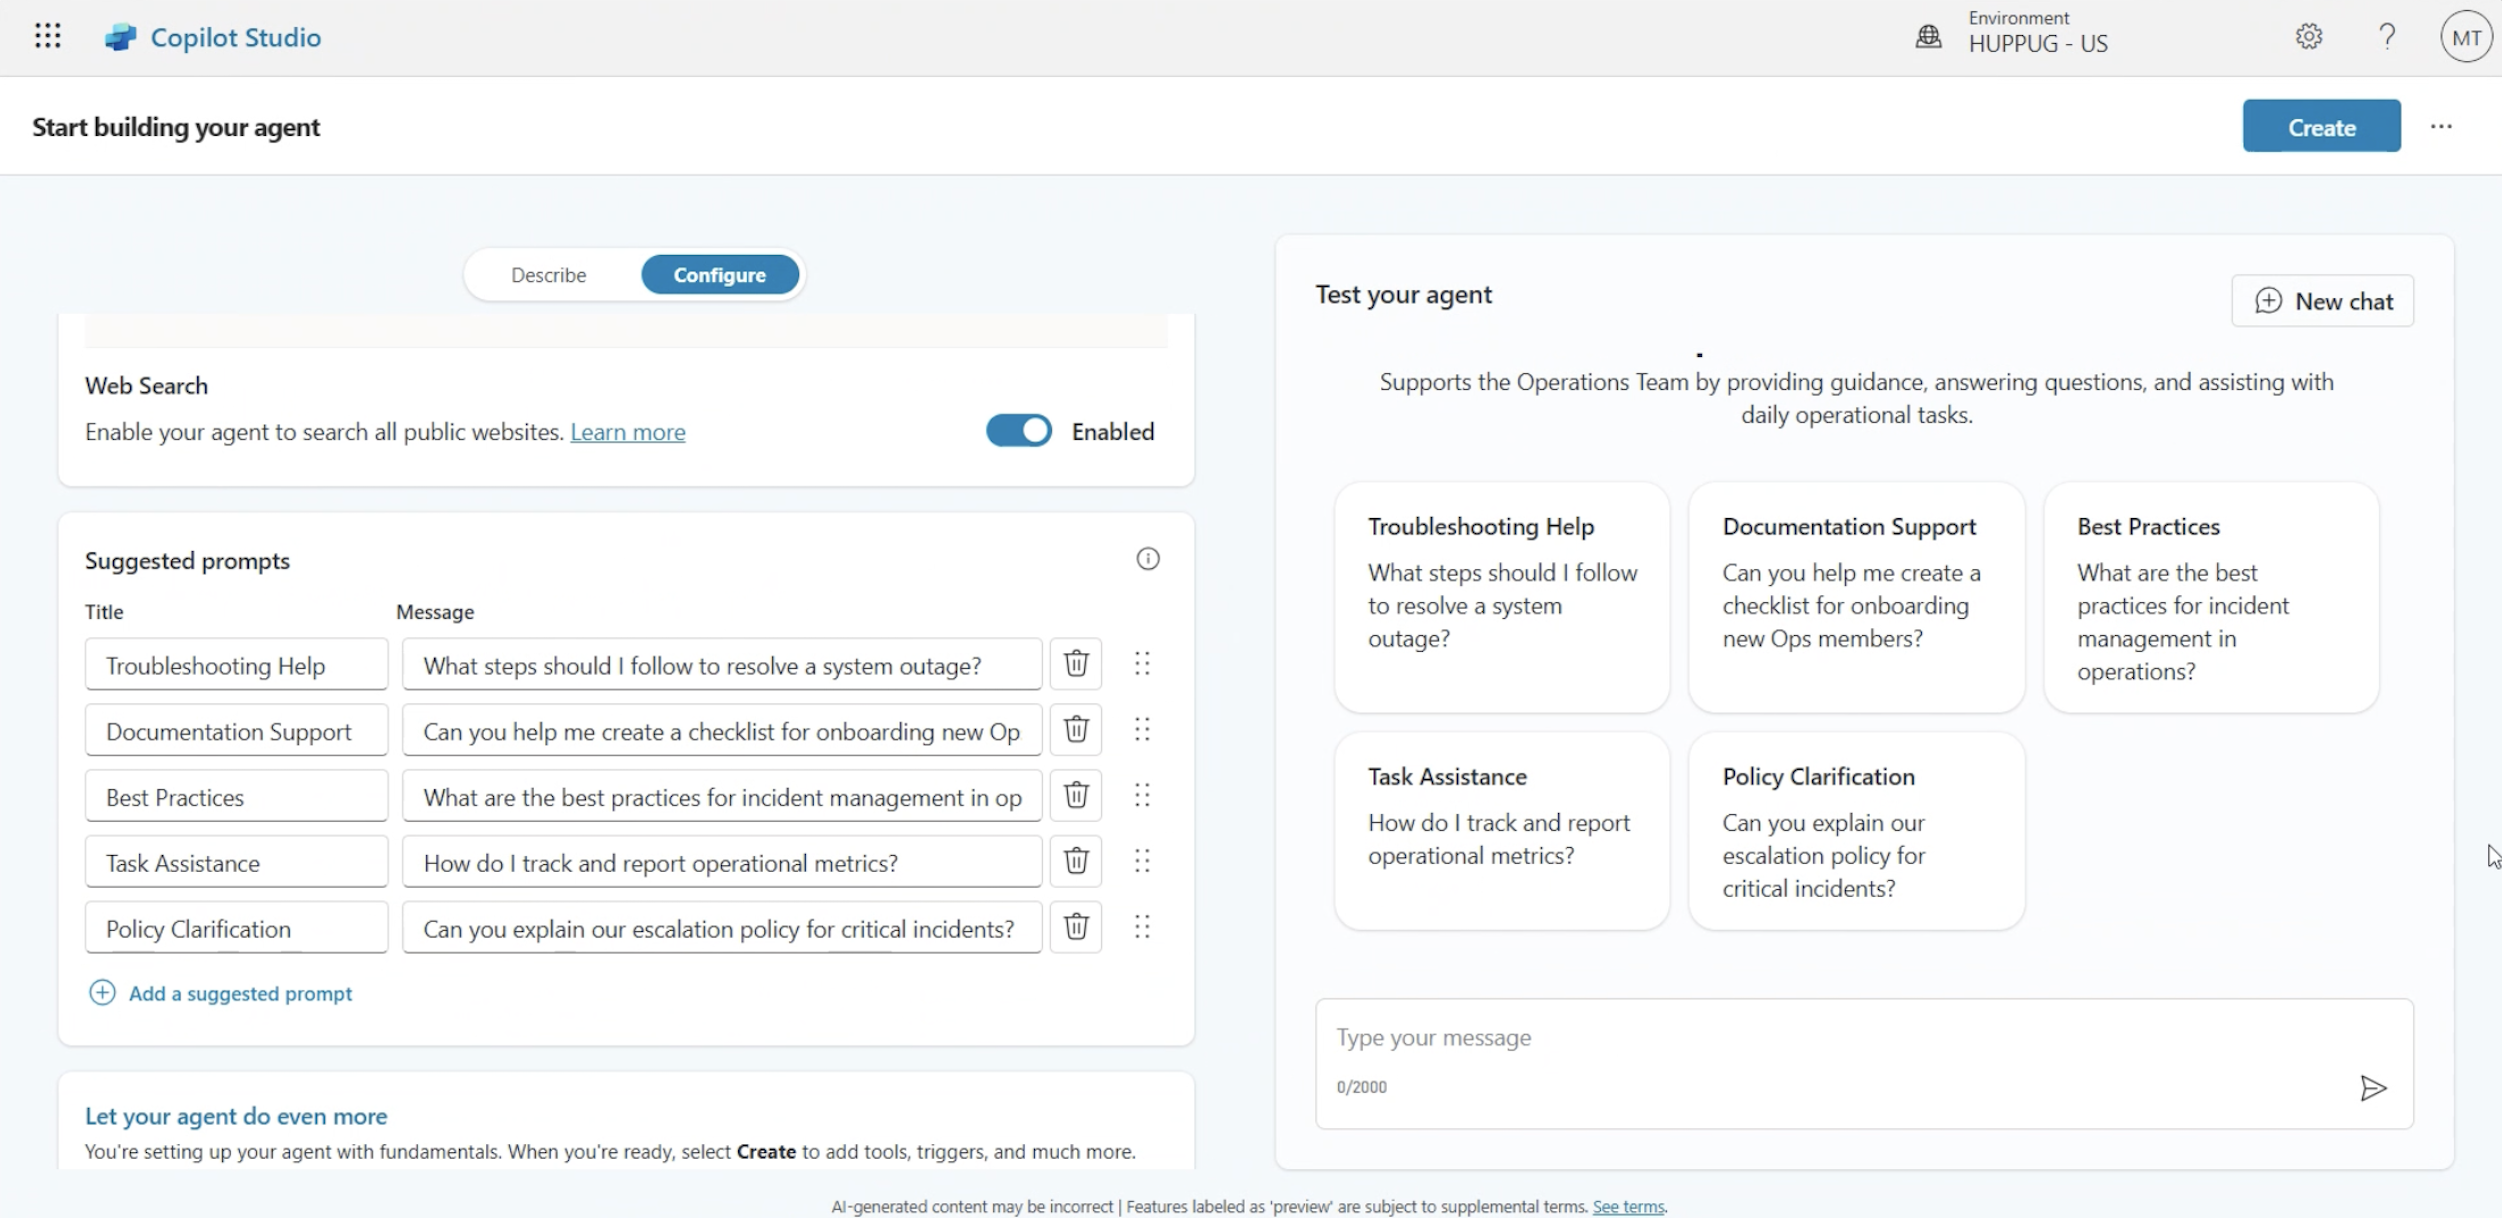
2. Configure your agent
- Content moderation: In the Agent → Generative AI menu, set rules for what your Copilot should (and shouldn’t) say. For example, if it can’t answer “XY”, define a safer fallback response.
- Knowledge sources: You can upload multiple knowledge sources, or add trusted public websites so the agent uses those instead of a blind web search.
- Add tools: Agents/Tools/Add a tool lets you extend functionality. For instance, connect a Meeting Management MCP server so your Copilot inherits scheduling skills without rebuilding them.
You’re not just configuring settings. You’re composing a system that reflects how your organisation works.
3. Pick the right model
Copilot Studio now offers newer model options beyond GPT-4.0, including more advanced and adaptive models (often labeled as “Auto” or experimental). These can feel sharper and more capable, especially for complex tasks, but they may still behave less predictably or be more sensitive to prompt design.
If stability and consistency matter — which is usually the case for IT Ops and production scenarios — it’s still a good idea to start with a more stable, well-understood model and only move to newer ones once you’ve tested them in your specific use case.
(As of March 2026. Model availability, naming, and behaviour continue to evolve, so it’s worth rechecking before making decisions.)
4. Validate your agent’s behaviour
As of now, there’s no automated testing of agents, but that doesn’t mean you should skip this step.
You can manually test your agent as the author. The Copilot Studio test panel allows you to simulate conversations, trace which topics and nodes are activated, and identify unexpected behaviours. The panel is there to help you spot gaps, so take the time to run realistic scenarios before publishing.
The difference between noise and value
Rolling out a custom agent isn't just dropping a chatbot into Teams. Done properly, it means embedding AI into real workflows where it drives real value; answering finance queries reliably, supporting service agents step by step, or orchestrating end-to-end automation across systems.
The difference between a useless bot and a trusted agent is preparation. Build with intent, configure with care, and test until you're sure it works properly.
You wouldn’t give a new hire access to your systems without training, policies, and supervision. Treat your AI agents the same way.
Need help automating workflows with Copilot Studio? Get in touch with AI engineers to discuss your use case.
TL;DR
Microsoft Fabric has become the fastest-growing product in Microsoft’s history in just 21 months. Its unification of previously fragmented tools, built-in real-time intelligence, AI-driven data agents, and full CI/CD support make it a turning point for users. Going forward, Fabric won’t be just another platform to support — it will be the foundation of enterprise data and AI. For IT Ops, that means shifting from fragmented support to proactive enablement, governance, and automation.
What problem is Fabric solving?
Historically, Microsoft’s data stack was a patchwork: Synapse for warehousing, Data Factory for pipelines, Stream Analytics for real-time, Power BI for reporting. Each had its own UI, governance quirks, and operational playbook.
Fabric consolidates that fragmentation into a single SaaS platform. Every workload – engineering, science, real-time, BI – runs on OneLake as its common storage layer. One data copy, one security model, one operational pillar. That means less time spent reconciling permissions across silos, fewer brittle integrations, and a clearer line of sight on performance.
This is the first part of our series on Microsoft Fabric. Read more about
- When to start using Fabric
- How to set up your first Fabric workplace, and
- The basics of Fabric licensing
How does real-time intelligence change the game?
Data platforms used to mean waiting until the next day for updates. Fabric resets these expectations. With Real-Time Intelligence built in, organisations can analyse telemetry, IoT, and application events as they happen — and trigger actions automatically.
For IT Ops, this changes monitoring from reactive to proactive. Anomaly detection and automated alerts are no longer bespoke projects; they’re native capabilities. The platform itself becomes part of the operations toolkit, surfacing issues and even suggesting resolutions before they escalate.
Is Fabric’s AI just Copilot?
So far, much of the AI conversation has centred on Copilot. But Fabric is pushing further, introducing data agents: role-aware, business-user-friendly assistants that can “chat with your data”.
This isn’t to replace analysts — the goal is to reduce bottlenecks. Business teams can query data directly, run sentiment analysis on CRM records, or detect churn patterns without submitting a ticket or waiting for a report build. IT Ops teams, in turn, can focus on platform health, governance, and performance, confident that access and security policies are enforced consistently.
How does Fabric fit into DevOps (DataOps) practices?
Fabric is closing the gap between data and software engineering. Every item, from a pipeline to a Power BI dataset, now supports CI/CD. GitHub integration is tightening, the Fabric CLI has gone open source, and the community is expanding rapidly.
For developers, this means fewer manual deployments, clearer audit trails, and the ability to fold Fabric artefacts into existing DevOps pipelines. Troubleshooting is also improving, with capacity metrics being redesigned for easier debugging and monitoring APIs opening new automation opportunities.
Why does this matter for IT operations going forward?
Fabric’s rapid progression is not just a vendor milestone. It signals a market demand for unified foundations, real-time responsiveness, AI-ready governance, and operational maturity.
As Fabric becomes the default data platform in the Microsoft ecosystem, IT operations will decide whether its promise translates into reliable, compliant, and scalable enterprise systems. From governance models to real-time monitoring to embedding Fabric into CI/CD, IT Ops will be the enabler.
What’s next for IT Ops with Fabric?
Fabric’s trajectory suggests it is on its way to becoming the operational backbone for AI-driven enterprises. For IT Ops leaders, the question is no longer if Fabric will be central, but how quickly they prepare their teams and processes to run it at scale.
Those who act early will position IT operations not as a cost centre, but as a strategic driver of enterprise intelligence.
Ready to explore how Microsoft Fabric can support your AI and data strategy? Contact our team to discuss how we can help you design, govern, and operate Fabric effectively in your organisation.
