

TL;DR
AI agents fail at scale if enterprise context is fragmented and inconsistent across systems. Work IQ structures operational context, but on its own it’s insufficient. Foundry IQ ensures external data can be retrieved in a governed, semantic, and explainable way, while Fabric IQ aligns and structures enterprise data into a consistent, cross-domain model. Together, they form a controlled context layer that defines what AI can access, retrieve, and reason over. This is what enables reliable, enterprise-grade decision-making, shifting AI from isolated productivity tools to scalable, trustworthy systems.
Move from fragmented data and systems to enterprise-grade context
As organisations grow across business units, regions, compliance environments and external platforms, continuity breaks. Operational systems hold one version of reality. Analytics platforms hold another. Knowledge lives somewhere else entirely.
Work IQ gives you continuity within day-to-day processes. But operational context alone isn’t enough.
Fabric IQ and Foundry IQ extend that continuity across domains and scale, aligning data meaning, governing retrieval, and ensuring agents operate inside a consistent, enterprise-wide context layer.
In Part 1, we talked about structuring the operational foundations using Work IQ.
In this part, we address the next question:
How does AI move beyond isolated productivity and into enterprise-grade decision-making?
What is Foundry IQ (in practical terms)?
Foundry IQ makes external data usable, not just connected. Most organisations assume that once a system is connected, AI can use it effectively.That assumption is wrong. AI does not “read everything.” It retrieves selectively. And retrieval quality determines output quality.
Foundry IQ exists to make external data usable within your enterprise context layer. Its purpose is not simple integration. It is structured, governed retrieval.
That means:
- Data must be indexed and searchable
- Retrieval must work by meaning, not just keywords
- Access must respect enterprise permissions
- Context must remain traceable and explainable
This is where vector embeddings matter. They allow AI to represent documents, records and conversations numerically, so retrieval is based on intent and semantic relevance rather than literal word matches.
From a business perspective, the implication is straightforward:
If meaning cannot be retrieved accurately, decisions cannot be trusted.
Foundry IQ ensures that external systems, like legacy platforms, line-of-business tools, and third-party services become part of the governed context layer instead of uncontrolled data feeds.
Without it, agents either operate with partial context or retrieve too much context and increase risk.
Neither scales safely. Structured retrieval is what turns raw connectivity into trusted knowledge.
What is Fabric IQ (in practical terms)?
In a nutshell, it turns enterprise data into structured meaning. As organisations grow, context cannot remain fragmented across departments.
Operational systems generate data. Analytics platforms reshape it. Leaders consume it in dashboards and reports.
Fabric IQ sits at this intersection.
Microsoft Fabric is designed as an enterprise data platform for large datasets, cross-domain transformations and advanced modelling. Its importance in the AI conversation is not novelty. It is structure.
Fabric IQ enables:
- Unified data models aligned to business processes
- Cross-domain visibility across finance, operations, sales and service
- Governed transformations and lineage tracking
- Auditability and policy enforcement at scale
In traditional analytics, well-designed data models improve reporting. In AI-driven environments, they become essential infrastructure.
Agents require structured, process-aware views of the organisation. Without semantic alignment, outputs reflect noise rather than signal.
Fabric IQ provides a reliable, governed lens into enterprise data, especially when information must be reshaped, combined or operationalised across domains. It turns raw data into business-ready context.
Why Foundry IQ and Fabric IQ matter for scaling autonomy
Highly capable agents are easy to prototype. Enterprise-ready agents are harder.
Without Foundry IQ, retrieval becomes inconsistent and difficult to govern. Without Fabric IQ, enterprise-wide context remains fragmented and difficult to operationalise.
Together with Work IQ, they create a company-level context layer that defines:
- What AI can see
- What AI can retrieve
- What AI can reason over
- What AI must not access
Autonomy becomes manageable only when these boundaries are explicit.
The progression is deliberate:
- Structure operational context
- Govern retrieval and integration
- Align enterprise data models
- Introduce autonomy gradually
This sequence reduces risk, improves explainability, and enables scaling with confidence.
Enterprise AI maturity starts with structured context, not smarter models
Organisations do not struggle with AI because models lack intelligence. They struggle because their context around them lacks structure.
Work IQ structures how work happens.
Foundry IQ governs how knowledge is retrieved.
Fabric IQ aligns how business meaning is defined across domains.
Together, they extend enterprise context beyond the obvious, beyond inboxes and CRM records, into governed, cross-domain, business-ready intelligence.
That is what allows AI agents to move from impressive demos to accountable production systems. Enterprise AI maturity is achieved through architecture, governance and data discipline. Autonomy then becomes a controlled capability, not an uncontrolled experiment.
Our team helps assess your agentic AI readiness, identify gaps in your data backbone, and design a roadmap that turns your structured work into trusted context for AI at scale.
Contact us for a free AI-readiness audit and practical next steps.
TL;DR
Work IQ is the part of your context layer that turns everyday operations into trustworthy signals for AI. It only works when your CRM, ERP, delivery, and collaboration tools share a common data backbone so records can travel end to end without duplication. Strengthen that backbone by fixing broken links like orphan tasks, generic time buckets, weak data validation, and manual handoffs that break context. Then test readiness by asking cross-system questions like true project cost versus quote or stalled opportunities without follow-up. If the answers require manual stitching, your context layer isn’t stable enough for autonomy yet. Once Work IQ is solid, you can scale into cross-domain meaning and governed retrieval in the next layers.
How to structure your context layer with Work IQ
Effective AI agents don't start with autonomy. They start with context you can trust. Before agents can reason, act, or provide insights that matter, your organisation needs a structured foundation of work and data that produces quality context as a by-product of everyday work.
But structured data alone isn't the goal. Complete integration is. The real value emerges when an agent can traverse your entire business operation in a single reasoning chain. Imagine asking your agent:
"How many hours did we work overtime on deliverable X for Customer Z, and what did that cost us?"
Or having it proactively nudge a sales rep to follow up on a lead that needs nurturing, then log a follow-up plan with tasks, timelines, and owners, all linked to the right opportunity.
These aren't futuristic scenarios. They're achievable today, but only when your systems are integrated tightly enough that a single record can travel from lead to opportunity, from project to timesheet, from deliverable to invoice, without context breaking along the way.
In this blog post, we share a practical framework for building a strong Work IQ layer: the part of your AI context stack that captures how work actually happens and turns it into structured, referential signals that AI can ground on.
(In Part 2 we'll discuss cross-domain context such as semantic business views and governed retrieval, but here we begin where you already have the most direct control: your operational systems and processes.)
What is Work IQ (in practical terms)?
Work IQ is Microsoft's intelligence layer that captures how work unfolds across tools and systems, collecting signals from productivity platforms so AI agents can understand people, documents, conversations, and activities in context.
It's part of Microsoft's unified IQ framework alongside Fabric IQ and Foundry IQ, but its core advantage is that it lives in systems you already use (Microsoft 365, collaboration tools, CRM/ERP) and reflects real work patterns.
Read more about Work IQ, Fabric IQ, Foundry IQ, and how they differ from Microsoft Graph →
Now let's walk through the three steps to shape your Work IQ into a foundation that agents can actually reason over.
1. Build a shared data backbone
The most common integration pattern in organisations is point-to-point: the CRM is connected to the project tool, the project tool to the time tracker, the time tracker to the finance system. Each connection is its own effort, with its own mappings and sync logic. This works up to a point, but it becomes fragile fast. When an agent needs to trace a record across four or five systems in sequence, a single broken link means it gets a wrong answer, or no answer at all.
The more resilient approach is to give all your systems a shared home for core business records. Instead of connecting each system to every other system, connect them all to one shared layer. When a customer record is created or updated in one system, every other system already has access to it, because they are all reading from and writing to the same place.
What this looks like in the Microsoft ecosystem
In practice, this is the role that Dataverse plays across Microsoft's business platform. It's not just a database. It's the shared backbone that CRM (Dynamics 365 Sales), ERP (Microsoft F&O), project delivery (DevOps, Project Operations), and collaboration tools (Teams, SharePoint) all treat as their native data home.
Here's how we use it:
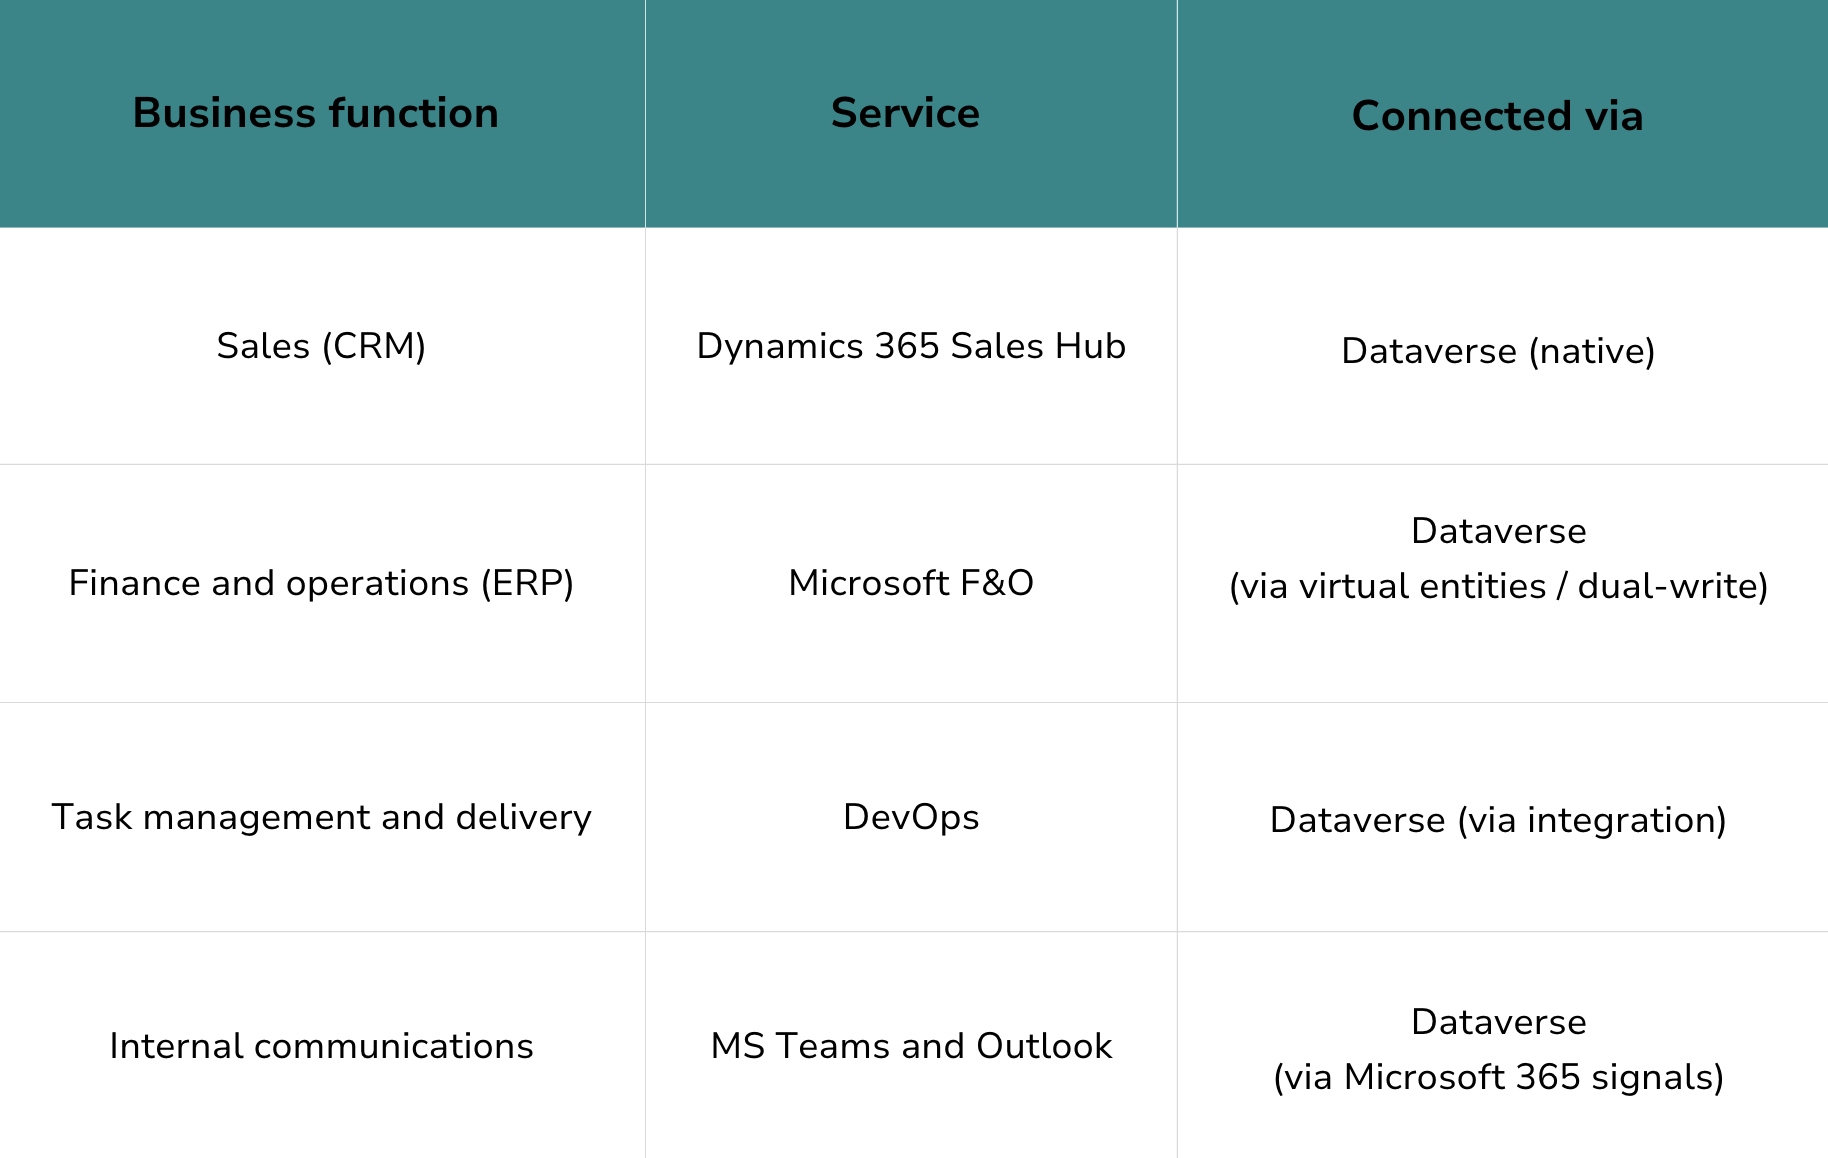
Although the exact stack may differ for your organisation, we suggest covering all core business functions with services that connect to a shared layer. This is where the Microsoft ecosystem has a distinct advantage: these services weren't bolted together after the fact. They were designed to share a common data foundation.
From first contact to final invoice: how a customer record travels through your systems
To see why a shared backbone matters, consider a single customer record.
It originates in Dynamics 365 Sales Hub during the sales process, as part of an opportunity. When the deal is won, a project record is created in the delivery system, but it doesn't start from scratch. It carries forward the customer reference, the contract value, and the deliverable structure from the original opportunity. Work items and timesheets logged against that project in DevOps all point back to the same record. When invoicing happens in F&O, the financial data connects to the same customer and project.
At no point was the record duplicated or re-entered. It was extended. This continuity is what makes it possible for an agent to answer a question like "what did deliverable X cost us for Customer Y?" in a single query, without stitching together exports from three different tools.
2. Strengthen the backbone
Having a shared data layer is the foundation. But it only works if the records that travel through it are complete, consistent, and properly linked. In practice, this means closing the specific gaps that cause records to lose context along the way.
Eliminate orphan tasks
Every task, work item, or time entry should connect to a business record. Review your backlog: if a task doesn't link to a customer, project, or cost centre, the agent can't attribute the work. Standardise tagging rules and enforce them going forward.
Quick test: Pick 20 random tasks from your backlog. If more than half lack a clear link to a customer or project, fix your tagging model before investing in AI automation.
Remove generic buckets
Hours logged to "internal," "miscellaneous," or "admin" are invisible to an agent trying to calculate project costs. Every hour needs a home. If the work genuinely doesn't belong to a customer project, create a structured internal category rather than a catch-all.
Enforce data quality at the point of entry
Poor data quality is almost always a process problem, not a tooling problem. Required fields, validation rules, and enforced state transitions prevent noise from entering the backbone in the first place.
For example: an opportunity cannot advance to "proposal sent" unless the expected close date and deal value are populated. A project can't be marked complete until delivery hours and costs are entered. These rules feel bureaucratic in isolation, but they're what make the backbone trustworthy at query time.
Automate handoffs between systems
When a deal is won, what happens next? If someone manually creates a project in a different tool and types in the customer name, you've introduced a potential break in the chain. Automate these transitions: winning an opportunity should auto-create a project record that carries forward the customer reference, contract value, and deliverable structure.
Anchor collaboration to the backbone
When a new project is created, auto-provision a Teams workspace and a SharePoint document library tagged to the same record. Apply consistent permissions and folder structures. This way, when an agent needs to combine collaboration signals (documents, meeting notes, decisions) with structured data (costs, timelines, deliverables), everything points back to the same place.
3. Test it by asking the questions
Come back to the questions from the introduction. The whole point of building a shared backbone and strengthening it is to make questions like these answerable:
- "What did deliverable X for Customer Y actually cost us, compared to what we quoted?"
- "Which open opportunities haven't had any follow-up activity in the last two weeks?"
- "How are our effective hourly rates trending across projects this quarter?"
Use AI to try answering them. Not as a production deployment, but as a test of your integration.
Things you can try:
- Ask AI to generate a draft quote from structured CRM data.
- Generate a project cost summary from linked tasks, timesheets, and financials.
- Produce a weekly executive briefing using your structured view of activity and outcomes.
- Ask the cross-system questions directly: "How much did deliverable X cost us for Customer Y?"
If the outputs are accurate, your backbone is holding. If they're inconsistent, require manual corrections, or miss data from one of your systems, you've found the next gap to close. Go back to step 2 and address it.
What we recommend: A skilled assistant that generates accurate drafts is usually 80% of the way to a capable autonomous agent. This helps teams see value early without risky autonomy, and it tells you exactly where the remaining integration gaps are.

Where complexity starts to grow
The steps above work well for individual domains and departments. But in complex, cross-domain environments with multiple business units, regional systems, compliance boundaries, and external data sources, a single backbone isn't enough.
That's where semantic models (Fabric IQ) and governed knowledge retrieval (Foundry IQ) become necessary. We'll cover those in our next blog post, with guidance on how to scale context across an enterprise without losing control.
Stay tuned for actionable steps to unify data meaning and retrieval across domains.
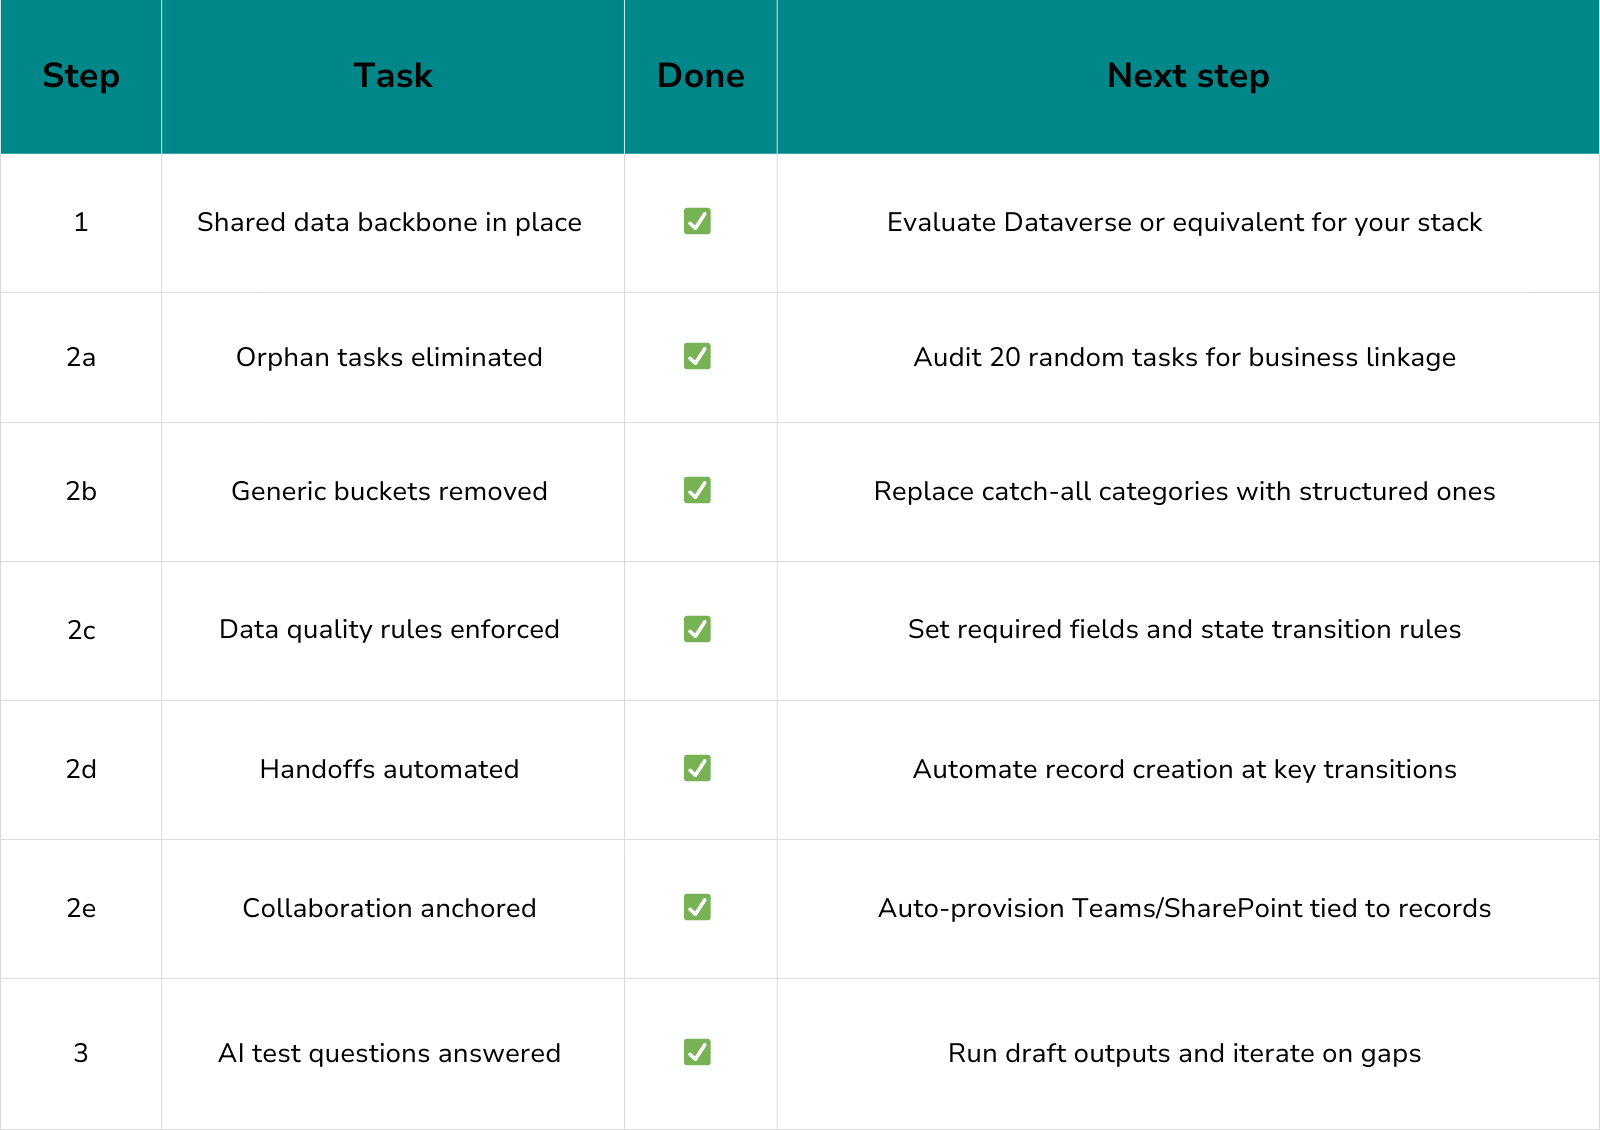
Practical readiness checklist
Want help turning context into value?
If your organisation spans multiple domains, systems, or regions, or if you're ready to scale beyond pilots to production-grade agent capabilities, a context architecture review can save months of trial and error.
Our team helps assess your Work IQ readiness, identify gaps in your data backbone, and design a roadmap that turns your structured work into trusted context for AI at scale.
👉 Contact us for a readiness audit and practical next steps.
TL;DR
Enterprise-ready AI agents require a governed context layer to safely scale autonomy. Many modern agents are optimised for speed and capability, but lack built-in boundaries, operational controls, and enterprise-grade oversight. Without structured data, controlled retrieval, and clear access governance, 'always-on' autonomy amplifies risk rather than value. Microsoft’s Work IQ, Foundry IQ, and Fabric IQ together form a company-level context layer that defines what AI can access and act on. Sustainable AI adoption starts with context, not capability.
Are you building autonomy before context?
AI agents are moving incredibly fast. Every week there’s something new: a demo, a prototype, or another “assistant” that can do things for you.
Some already feel close to real. They are always on, connected to your tools, and able to take action. Projects like OpenClaw pushed this idea even further. It looked like it worked, until one agent deleted a user’s entire inbox.
Many of these agents look impressive in isolation, but the moment you try to connect them to real business processes, real data, or real users, things start to feel off.
You go from “this looks impressive” to “this might break things.”
It’s tempting to ignore that uneasy feeling. You shouldn’t. It’s usually right.
‘Always-on' agents look like a great idea but come with serious risks
Some of the newer agent frameworks feel almost human.
- They respond instantly.
- They don’t pause the chat while they think.
- They keep working even when you’re offline.
That’s the appeal. And that’s why they’re tempting to bring into enterprise environments. But many of these agents are optimised for speed and capability, not stability, governance, or enterprise-grade safety. They’re built to generate the most plausible 'best fit’ to your instructions, not to apply judgment.
Once connected to real systems and data, that becomes an operational risk: actions at machine speed, without predictable boundaries, reliable controls, or the monitoring and audit trails you’d expect from any production system. In a demo, it looks like productivity. In production, it can turn into liability with unpredictable outcomes, unclear accountability, and disproportionate security exposure.
Unless you've explicitly designed guardrails, these ‘always on’ agents won’t naturally slow down, push back, or flag a bad idea. And the most important guardrail you can establish is the shared context the enterprise can trust.
The real foundation: a shared context the enterprise can trust
Before an agent can act safely, it needs to understand where it’s operating.
- What data is relevant?
- What data is off-limits?
- What actions are acceptable?
- What outcomes matter?
That understanding doesn’t come with the agent by default. You need to build it into your context layer.
Microsoft describes this through three interconnected concepts: Work IQ, Foundry IQ, and Fabric IQ.
Together, they define what an AI can see, retrieve, and reason over; and just as importantly, what it can’t.
Until proper governance is in place, how do we prepare for an undefined AI-driven future?
In enterprise environments, ‘always-on’ doesn’t just look impressive but amplifies risk. Once an agent connects to real systems, data, or customers, speed and autonomy become force multipliers. If something breaks, it breaks faster and at scale.
That’s why highly autonomous agents hit predictable limits. They are
- costly to run,
- hard to secure across tools and data sources,
- difficult to troubleshoot when decisions aren’t transparent, and
- prone to unpredictable behaviour inside complex end-to-end processes.
The issue usually isn’t the model itself. It’s the missing fundamentals: clear boundaries, governance, and operational control. Agents are deployed without the guardrails and oversight you would expect from any production-grade capability.
Preparing for an undefined AI future, then, doesn’t start with more autonomy. It starts with foundations. Microsoft’s approach reflects this shift: prioritising a company-level context layer that governs what agents can access and act on before autonomy is scaled.
Work IQ: where enterprise AI actually starts
Work IQ is the most underestimated part of this story, and arguably the most important.
It represents everything tied to an individual’s work:
emails, files, Teams conversations, calendars, even document changes in tools like Word or Excel. This is the day-to-day reality of how work happens.
For Work IQ to function well, a few things must already be true:
- People store their work in governed systems like SharePoint
- Information protection, retention, and access policies are mature
- Business data lives in structured systems, not spreadsheets and inboxes
If you’re using Dynamics 365 and Dataverse-based Power Apps, you’re already ahead here. Your sales, finance, or service data is structured by design, which makes it usable and governable by AI.
Without this foundation, agents fail quietly, by giving confident answers based on partial or outdated context.
Foundry IQ: make external data usable, not just accessible
Of course, not everything lives in SharePoint or Dataverse. This is where Foundry IQ comes in. Its role is to connect external data sources into the same context layer, but in a way that AI can actually work with.
The critical assumption here is often overlooked: AI can’t read everything at once.
Retrieval has to be selective. That means data must be indexed, searchable, and retrievable by meaning, not just by keyword. This is why vector embeddings matter. They allow AI to represent context, intent, and even sentiment numerically, making it possible to retrieve the right information instead of all information.
You don’t need to understand the math behind embeddings to benefit from them. From an operations perspective, the requirement is simple:
document meaning must matter in search and retrieval.
When that’s in place, AI can consume external data sources just as naturally as internal ones.
Fabric IQ: turn raw data into business-ready context
As organisations scale, context can’t remain fragmented. This is where Fabric IQ plays a crucial role.
Fabric is Microsoft’s enterprise data platform, designed for pro-code scenarios, large datasets, and complex transformations. Its value in the AI conversation isn’t novelty but structure.
Well-designed data views aligned to business processes have always been powerful for reporting. In the age of AI, they become essential. They give agents a reliable, process-aware lens into the organisation, grounded in governance, security, and auditability.
Fabric IQ is what enables a true company-level context layer when data needs to be reshaped, combined, or operationalised across domains.
Why this sequence matters
There’s a pattern we see again and again. Organisations start experimenting with agents. The pilot works. The demo is convincing. Then someone asks the uncomfortable questions:
- Who owns this agent?
- What data is it allowed to touch?
- How do we stop it?
- How do we prove what it did yesterday?
If those questions can’t be answered quickly, scaling stalls. Or worse, risk accumulates silently.
This is why the order matters:
First, establish context.
Then, govern access and retrieval.
When governance is in place, introduce autonomy gradually.
Agents don’t become enterprise-ready by being smarter. They become enterprise-ready by operating within well-designed context layers.
The real question before you scale: is your context layer ready?
When implementing AI agents, the goal isn’t maximum autonomy. It’s manageable autonomy: autonomy you can explain, monitor, and scale with confidence.
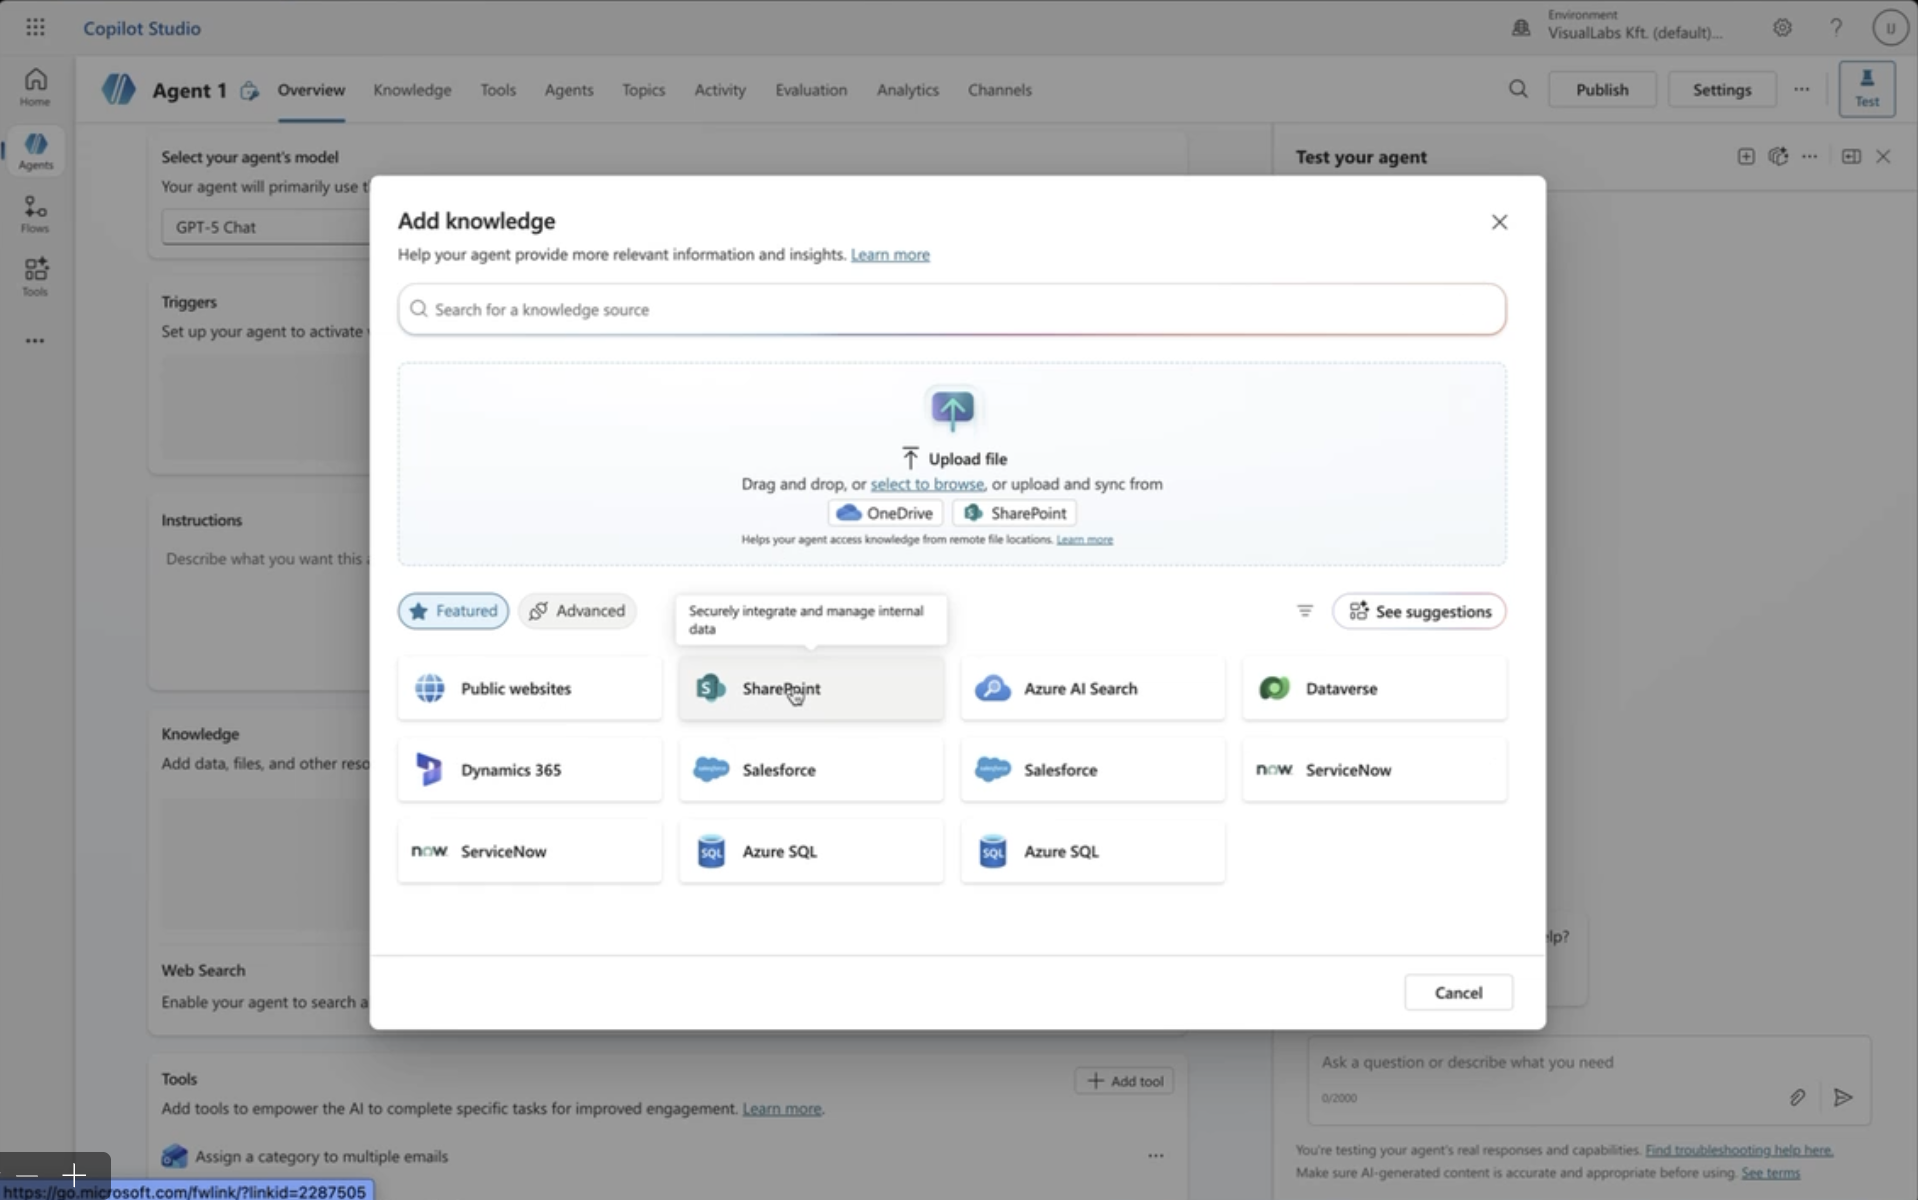
Copilot Studio helps you build agent capabilities. The broader Microsoft control plane helps you run them safely.
If you’re thinking about moving from pilot to production, the most important question isn’t what the agent can do. It’s whether your context layer is ready to support it.
We help organisations assess AI readiness, data foundations, and governance gaps before autonomy becomes a risk. Get in touch for a free audit.

TL;DR
Copilot Studio agents are moving from answering questions to taking actions across Microsoft 365 and business systems, which shifts the risk from wrong answers to wrong actions. Copilot Studio orchestrates what agents do at runtime, but scaling safely requires a control plane: visibility, agent identity, least-privilege access, monitoring, and auditability across the whole fleet. Without that, organisations hit blind spots in inventory, access, and execution, and trust breaks the moment something goes wrong. Agent 365 fills this gap by making agents accountable and operable at enterprise scale, without replacing Copilot Studio or making agents smarter.
When Copilot Studio agents start taking action, risk becomes real
Agents are no longer just chatbots that answer questions. They increasingly take actions across Microsoft 365 and connected business systems. That shift also changes the risk profile: it’s no longer “What if the answer is wrong?” but “What if the action is wrong?”
As soon as agents can create, update, share, or trigger things on your behalf, orchestration stops being a nice-to-have feature and becomes a production control surface.
Answers were safe but actions need control
Imagine a helpful internal agent. It creates a document but saves it in the wrong SharePoint library. It sends an email, but to a broader audience than intended. It updates a record, but in the wrong system, or with outdated context.
None of these are dramatic failures on their own. But at scale, across dozens or hundreds of agents, they become operational landmines.
This is the uncomfortable truth many organisations are now facing: autonomy without visibility creates blind spots and allows anomalies to fester.
Today’s models are already competent enough to be trusted with meaningful work — if they have the right context and guardrails. The real risk doesn't come from a lack of intelligence, but a lack of context and oversight.
Orchestration now means two different things
When people talk about orchestrating agents, they often mix up two very different layers. Both matter, but they solve different problems.
Runtime orchestration: how an agent does its job
This is what most teams associate with Copilot Studio. Runtime orchestration is about how an agent:
- chooses which tools to use,
- selects topics or knowledge,
- chains multiple steps together,
- asks for missing inputs when needed,
- or even delegates work to other agents.
Copilot Studio supports generative orchestration, where the agent dynamically decides what to do next based on intent and context, rather than following a fixed, scripted flow. This is what makes agents useful.
Enterprise orchestration: how agents are governed at scale
This is where Agent 365 comes in. Enterprise orchestration is about:
- identity,
- access,
- lifecycle management,
- monitoring,
- auditability,
- and operational ownership, across a whole fleet of agents.
In simple terms:
Runtime orchestration makes agents useful.
Control-plane orchestration makes them safe to scale.
Copilot Studio agents are not “free-roaming bots”
When used well, Copilot Studio already encourages good discipline. It works best when agents have:
- well-defined intents,
- bounded toolsets,
- explicit data sources,
- and repeatable workflows.
Think of this modularity not as a limitation, but a design advantage. Smaller, focused agents reduce the action surface and make everything easier to control: testing is simpler, permissions can stay tight, and ownership becomes much clearer.
As complexity grows, best practice is to split responsibilities across multiple agents rather than building one all-knowing assistant. Connected or child agents keep behaviour precise and predictable, while still enabling collaboration.
This is how teams avoid accidental overreach long before governance becomes a problem.
Reach is expanding in two very different ways
As agents mature, their influence grows, but not in just one direction. It expands along two separate axes and mixing them up is where a lot of teams get caught off guard.
The first is distribution reach: where the agent shows up. Agents are no longer hidden away as small experiments that only a few people know about.
They’re starting to surface inside everyday work: in Microsoft 365 Copilot experiences, in Teams, in shared environments, and increasingly through curated “agent store” style publishing.
Once you reach that point, the way you build changes too. You can’t rely on ad-hoc setups anymore, because publishing and reuse demand structure: versioning, consistent behaviour, clearer ownership, and a way to manage what people are actually deploying.
The second is operational reach, and this is the more consequential shift: what the agent can touch.
Today’s agents don’t just answer questions. They can interact with Microsoft 365 data, pull from SharePoint, trigger actions in Dynamics, reach into line-of-business systems, and even call external services. In other words, they’re moving from “helpful assistant” to “active participant” in real processes.
And this is the moment governance stops being a nice-to-have. Because once an agent can take action across systems, the cost of a blind spot isn’t a just weird response in chat; it’s the wrong update in a record, the wrong document shared, or an action taken with more permission than it should ever have had.
Autonomy creates three blind spots, and they break trust
Autonomy tends to create three blind spots, and that’s usually where trust starts to crack. Business leaders experience it as risk. Ops teams experience it as losing control. And when you look closely, the blind spots almost always show up in the same three places: inventory, access, and execution.
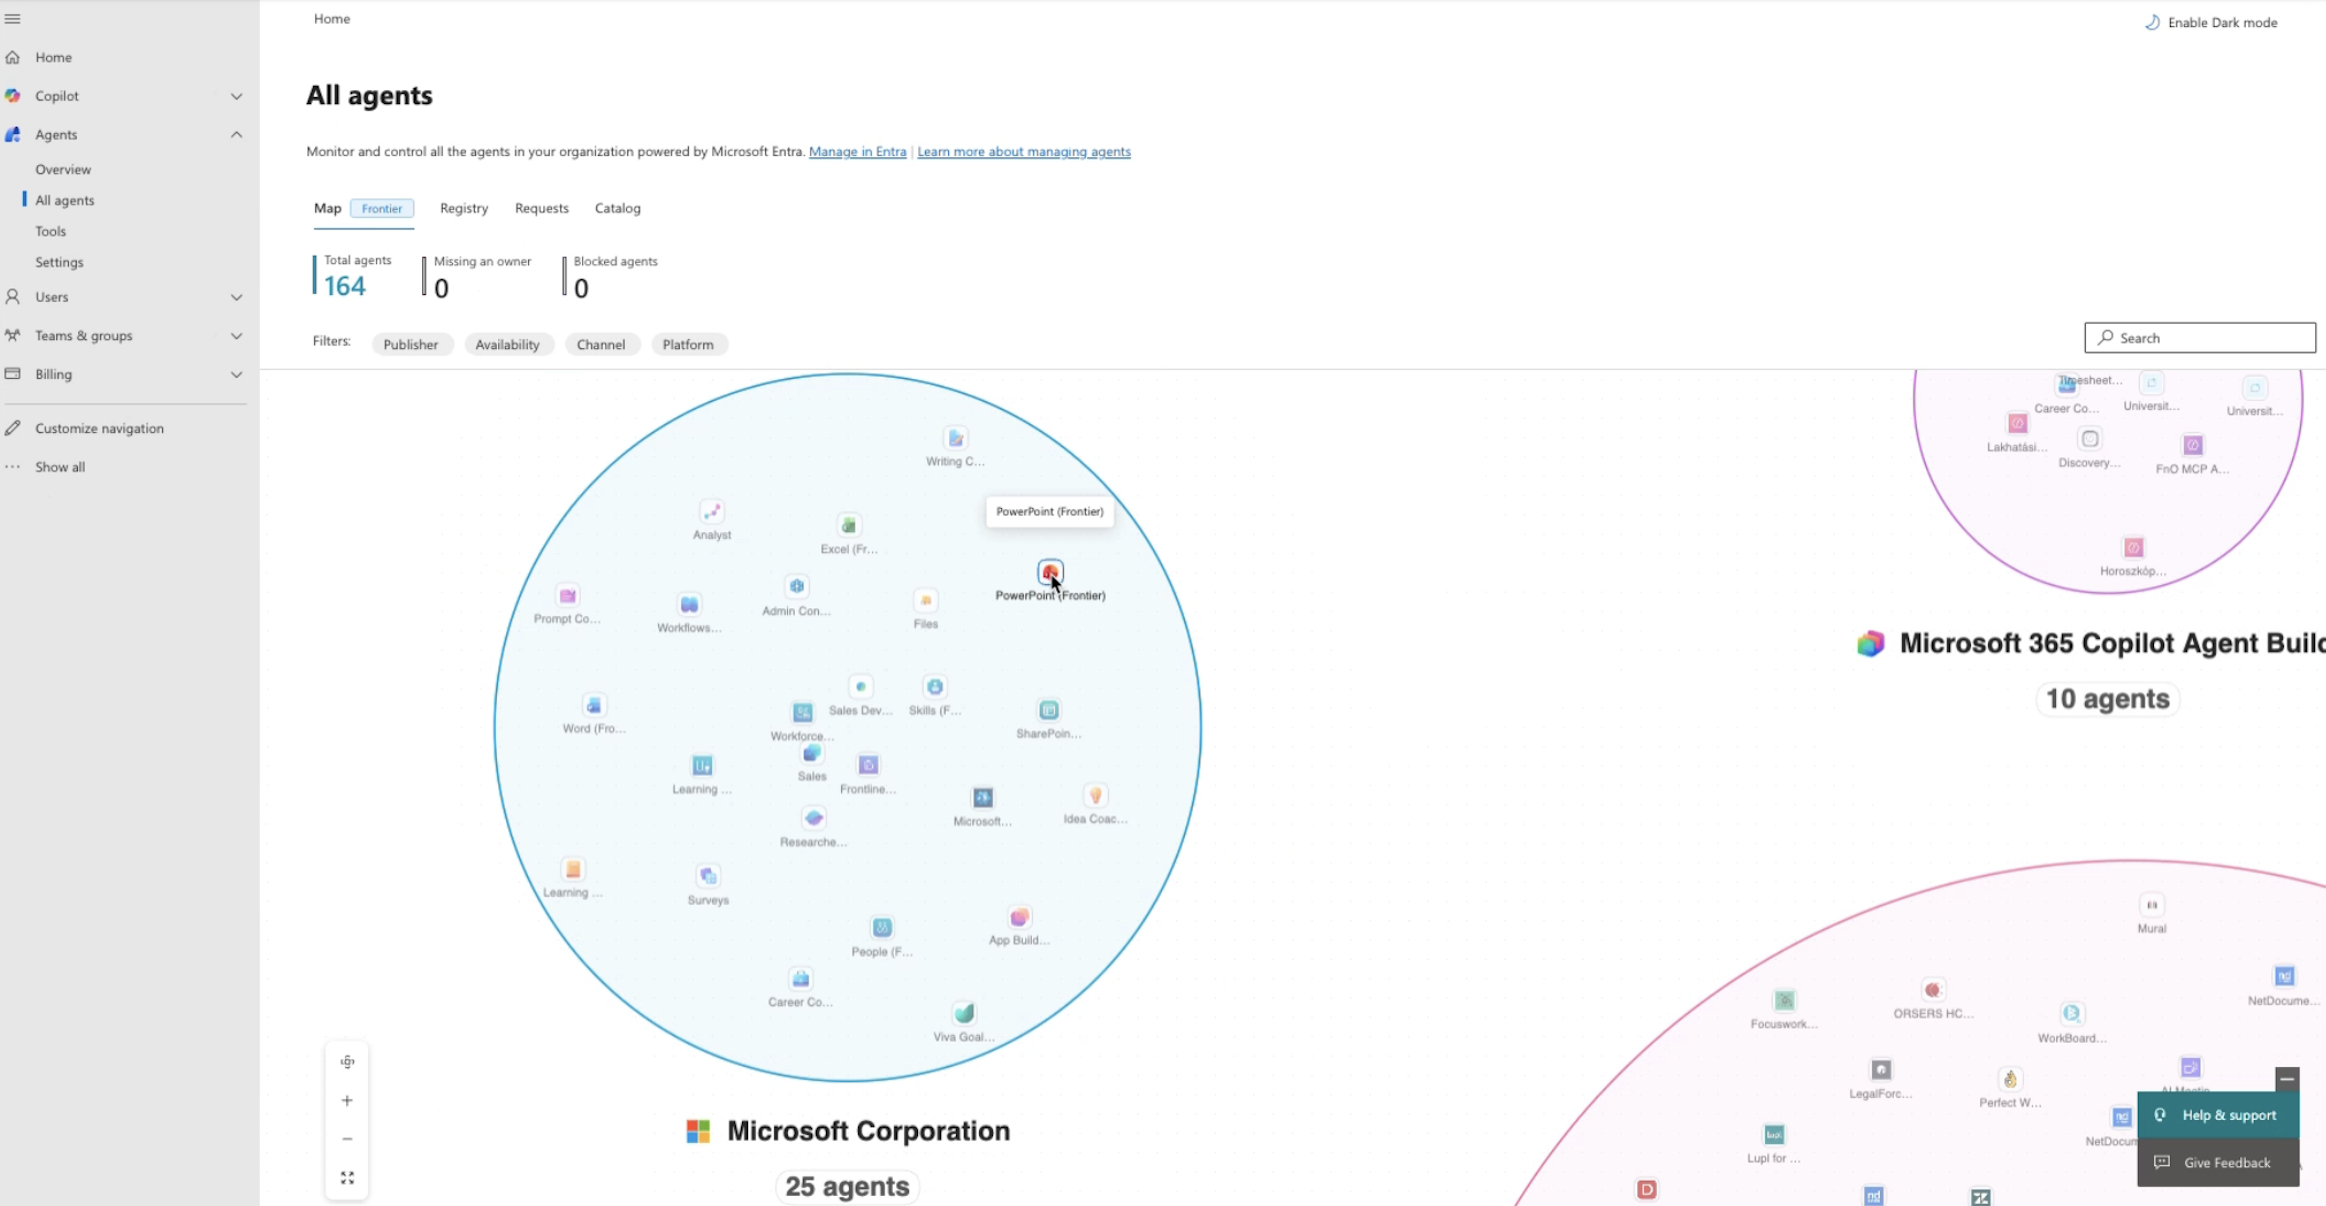
1. Inventory blind spot
- How many agents exist today?
- Which ones are sanctioned?
- Who owns each one?
- Which are abandoned?
If you don’t have clear answers to these questions and an up-to-date inventory, agents become a ticking time bomb, much like unmanaged SharePoint sites with no owner or a single forgotten admin. You can’t secure what you can’t see.
2. Access blind spot
What can each agent access right now, and why?
Without explicit agent identities and least-privilege policies, agents often inherit more access than intended. This mirrors a familiar pattern from cloud adoption: overshared sites, legacy permissions, and “nobody noticed until it became an issue”.
AI adoption amplifies this risk because agents don’t just read, they act.
3. Execution blind spot
When something goes wrong, the questions come fast:
- What did the agent do?
- Was it compliant?
- Can we investigate?
- Can we respond?
Without granular logging and agent-level monitoring, you don’t really have incident response, you have guesswork.
Agent 365: the control plane for AI agents
Agent 365 exists to close these gaps. Not by changing how agents think, but by making them operable.
What Agent 365 actually does
In plain terms, it brings enterprise-grade discipline to managing a fleet of agents.
It gives you a central registry so you can see what agents exist, who owns them, and quarantine anything unsanctioned. It adds agent-level access control: a dedicated identity with policy-based, least-privilege permissions that doesn’t just piggyback on the user.
It also improves visibility with telemetry, dashboards, usage and performance tracking, and even ROI measurement at the agent level. On top of that, it’s built for interoperability, so it can work across Microsoft platforms and beyond without forcing lock-in, and it integrates into existing security and monitoring models instead of bypassing them.
Taken together, it’s what turns agents from “cool experiments” into managed, operational entities.
What Agent 365 is not
Just as important: it’s not here to replace Copilot Studio. Copilot Studio is still where you design agents and orchestrate what they do at runtime.
And it doesn’t make agents “smarter.” It makes them accountable, monitorable, and scalable.
Organisations need to shift from building agents to running them
Many organisations already have dozens of agents running, often without realising it.
Without a control plane:
- autonomy grows faster than visibility,
- governance lags behind adoption,
- and trust erodes the moment something goes wrong.
Agent 365 marks a clear shift in mindset: from “Can we build agents?” to “Can we run them safely in production?”.
This is the moment when agents stop being clever helpers and start becoming part of your operating model. Once they have accountability, not just answers, there’s no going back.
If you’re heading there and want to check what’s in place and what needs fixing, get in touch for a free audit.
TL;DR
Most agentic AI initiatives fail not because of the technology, but because organisations try to use AI to compensate for weak data, broken processes, misaligned behaviours, and unclear ownership. Common mistakes repeat across maturity stages: assuming AI will clean up chaos, underestimating change management, treating PoCs as proof of value, using rigid delivery models, automating unstable processes, and applying governance that either blocks learning or erodes trust. The companies that succeed treat agentic AI as a maturity journey, stabilising processes first, aligning people and incentives, designing for iteration, and using governance to enable safe scaling.
Agentic AI has moved fast from hype to experimentation. Most organisations now have at least one agent running somewhere; a Copilot, a workflow assistant, a triage bot, or a proof of concept built on Power Platform or Azure.
And yet, months later, many leaders are left asking the same question:
What did this actually change for the business?
The issue is rarely the technology. The biggest mistakes we’ve sees are structural, organisational, and AI readiness-related. They tend to repeat themselves depending on where a company is in its agentic AI journey.
Below, we break down the most common mistakes by stage, explain why they are serious, and show how to avoid them.
This is the fifth part of our series on agentic AI. Read more about
- How to get your organisation ready for agentic AI
- How to introduce AI into your business processes
- How to help employees adopt agentic AI
- How to turn agentic AI experiments into real business value
- How to upskill your agents for real work
1. Planning stage: You’re assuming AI can fix chaos
Believing that AI will compensate for poor data and unclear processes is one of the most common mistakes we see.
Assumptions often sound like this:
“Once we add AI, things will become cleaner and smarter.”
In reality, agentic AI amplifies whatever it touches. If your data is inconsistent, fragmented, or manually maintained (for example in spreadsheets), the agent will not magically improve it. It will inherit the same confusion — and distribute it faster.
A useful rule of thumb is simple:
If you cannot make sense of your data, you cannot expect AI to make sense of it either.
Why this is serious
Dirty data usually isn’t just a data problem. It’s a process problem. Most “bad” data comes from manual handovers, workarounds, and parallel systems that exist because the underlying process never worked properly.
Trying to clean data without addressing the process that produces it only creates technical debt.
How to avoid it
- Start with process ownership, not AI tooling.
- Replace uncontrolled manual steps with systems designed to manage business processes (for example CRM instead of Excel-based tracking).
- Accept that some long-standing habits will need to change. AI readiness requires organisational courage, not just technical effort.
2. Preparation stage: You’re underestimating the cost of change
Thinking preparation is mainly a technical exercise is another big misconception.
Even when organisations recognise the need for better data and processes, they often underestimate the human side of the change. Long-standing “this is how we’ve always done it” behaviours don’t disappear just because a new platform is introduced.
Resistance often comes from experienced employees who feel their proven ways of working are being questioned.
Why this is serious
Agentic AI depends on consistent behaviour. If people continue to bypass systems or maintain shadow processes, agents will never see a complete or reliable picture of reality.
This is also where dissatisfaction can surface, usually coming from teams feeling stuck with outdated tools while leadership talks about “modern AI”.
How to avoid it
- Be explicit about why change is necessary, not just what is changing.
- Treat system adoption as a business initiative, not an IT rollout.
- Measure progress not only in features delivered, but in behaviours changed.
3. PoC stage: You’re mistaking early success for scalability
Many teams overestimate the value of proofs of concept. Everyone wants PoCs. They are fast, visible, and relatively safe. And they often work impressively in isolation.
The problem is that PoCs are rarely designed to scale.
They prove that something can be done, not that it should be done or that it will survive real operational complexity.
Why this is serious
Many organisations get stuck in a loop of perpetual experimentation. Agents are demonstrated, praised, and quietly abandoned when they fail to deliver measurable impact.
This creates AI fatigue and scepticism long before the technology has had a fair chance.
How to avoid it
- Define success in operational terms from day one.
- Ask early: What process does this change? Who owns it? How will we measure improvement?
- Treat PoCs as learning tools, not as evidence of ROI.
4. Pilot stage: You’re choosing the wrong delivery model
Many organisations default to waterfall-style delivery when building agentic AI. While the waterfall approach is effective in stable environments, it relies on fixed requirements defined upfront. Agentic AI rarely works like that.
The hardest part isn’t building the agent. It’s discovering what the agent needs to know, and that knowledge only emerges through use, feedback, and edge cases.
Why this is serious
Rigid delivery models make it difficult to adjust as reality surfaces. Teams end up locking in assumptions that turn out to be wrong, and pilots struggle to adapt.
How to avoid it
- Accept that agentic AI requires continuous discovery.
- Use iterative delivery to surface hidden assumptions early.
- Involve people who are willing to be “confused on purpose” and ask uncomfortable questions about how work actually happens.
Agile ways of working are not free. They require time, discipline, and strong collaboration. But they significantly reduce the risk of building something that looks right and works nowhere.
5: Go-live stage: You’re trying to automate broken processes
Placing AI on top of unclear or fragile processes almost never works.
A common question we hear is:
“Can’t we just add AI to what we already have?”
You can. But it is one of the fastest ways to stall ROI.
Agentic AI does not fix broken processes. It inherits them.
Why this is serious
Unclear ownership, undocumented exceptions, and tribal knowledge create unpredictable agent behaviour. This is often misdiagnosed as a model issue, when it is actually a process issue.
Employees may request AI support because something is painful, not because it is ready to be automated.
How to avoid it
- Stabilise and simplify processes before introducing agents.
- Make decision points, exceptions, and escalation paths explicit.
- Treat agent design as an opportunity to improve the process, not just automate it.
6: Adoption and scaling stage: You’re getting governance wrong
Being either too restrictive or too loose with governance are both common mistakes. Fear-driven governance can be as damaging as no governance at all.
If access is too restricted, domain experts cannot experiment, prompts never advance, and agents remain disconnected from real work. If governance is too loose, trust erodes quickly when something goes wrong.
Why this is serious
Agentic AI sits at the intersection of business and IT. Scaling requires both sides to work together. Without clarity on decision rights, accountability, and maintenance, adoption stalls.
How to avoid it
- Define who owns agents, risks, and ongoing changes.
- Enable domain experts to work with AI, not around it.
- Treat governance as an enabler of trust, not a barrier to progress.
A final mistake: locking yourself into narrow assumptions
Across all stages, one pattern appears again and again: organisations arrive with strong hypotheses and only look for evidence that confirms them.
This often leads to missed opportunities. Teams optimise locally while overlooking areas with far greater potential impact.
Agentic AI rewards openness. The biggest gains often appear where organisations are willing to question long-held assumptions about how work should be done.
How to move forward safely
Introducing agentic AI is not a single decision. It is a maturity journey. The organisations that succeed are not the ones deploying the most agents, but the ones willing to clean up their foundations, rethink the processes agents will sit inside, align people and governance early, and stay open to the uncomfortable discovery that comes with making implicit work explicit.
Want a clear view of where you are today and what to fix first?
We can run a short AI readiness review and help you prioritise the changes that will make agentic AI safe, adoptable, and measurable.
TL;DR
Agentic AI is moving from experimentation to execution, and access to tools is no longer the limiting factor. What separates stalled pilots from real impact is whether agents have the operational skills to work safely inside real processes. These skills include clean inputs, process context, governance, and the ability to validate and escalate decisions. Defining them forces organisations to confront how work actually gets done, not how it’s documented. Scaling agentic AI therefore means scaling maturity and skills first, not rolling out more agents or licences.
2026: the year agent skills matter more than tools
2025 was the year of agents, with almost everyone experimenting. Copilots appeared in familiar tools, pilots were launched, and AI proved it could accelerate knowledge work.
In 2026, the focus will change. The organisations that move ahead won’t be the ones deploying more agents. They’ll be the ones investing in something far more difficult: developing the skills that allow agents to operate safely and reliably inside real business processes.
Access to AI is no longer the constraint. The real question has become:
Do our agents have the skills required to execute business-critical work?
This is the fifth part of our series on agentic AI. Read more about
- How to get your organisation ready for agentic AI
- How to introduce AI into your business processes
- How to help employees adopt agentic AI
- How to increase the ROI of agentic AI initiatives
- The biggest mistakes companies make when introducing AI
Why defining the right tools is harder than getting them
Until recently, AI adoption was limited by access to models, platforms, compute, or licences. That barrier has largely disappeared. Competitive LLMs exist both inside and outside the Microsoft ecosystem, and most enterprises already have Copilot or similar tools in place.
Yet many initiatives stall after the pilot phase. Not because the technology fails, but because organisations are unprepared for what agents actually need to be effective: clean inputs, defined processes, traceable decisions, and safe execution paths.
The LLM models and embedding frameworks are already here. The question is whether your operational maturity is.
What do we actually mean by “agent skills”?
Agent skills are not prompts or plugins. They are the operational capabilities that allow an agent to do real work without becoming a risk.
In practice, skills combine:
- access to systems and artefacts,
- context about domain rules and process history,
- the ability to reason, execute, validate, and escalate,
- and clear boundaries for governance and safety.
This is why the conversation has moved from “Do we have the right tools?” to “Do our agents have the skills to handle business-critical processes?”
Why terminal access matters for agents
Many agents today operate in chat-only mode. That is useful for summarising, drafting, or answering questions, but it quickly becomes a ceiling.
To unlock real capability, agents often need controlled terminal access. Modern agents behave less like chatbots and more like junior engineers:
- they need to inspect repositories,
- review work item history,
- understand configuration,
- and correlate changes across systems.
A typical example is enabling read access to Azure DevOps or GitHub using scoped Personal Access Tokens. Combined with Azure CLI or repository access, an agent can begin to understand how a process evolved, not just what it looks like today.
This is where agents become genuinely useful for IT Ops. With access to work item history, commits, and deployment context, an agent can investigate recurring issues, surface undocumented decisions, or even generate accurate documentation, which is something humans rarely have time to do consistently.
Why does agent development force uncomfortable discovery?
When you define what an agent would need to execute a workflow safely, you are forced to map the real process, not the idealised version.
Questions quickly surface:
- Is there a template for this request?
- Who validates this step?
- Who is accountable for the decision?
- What evidence do we keep that the process was followed?
These questions are often new, not because the process is new, but because it was never formalised. Agent development turns hidden assumptions into explicit requirements. That can be uncomfortable, but it’s also where real improvement starts.
This is why scaling agentic AI isn’t only about building agents but about upskilling them: designing them with the right decision rules, guardrails, and proof points so they can operate safely in the real world, not the imagined one.
What does “upskilling an agent” actually look like?
To upskill an agent, you don’t just retrain the model. You also need to progressively expand trust.
Typically, this starts with visibility rather than action. The agent is allowed to inspect and explain before it is allowed to execute. Validation and approval steps are introduced early, and only once the process is stable does automation expand.
Agents often work surprisingly well with “just” access, but only if the underlying data and process history are clean. If DevOps tickets lack context or key decisions live only in meetings, the agent will reflect those gaps back to you.
In that sense, upskilling your agents and improving your processes happen together.
Why scaling always requires scaling agents’ skills first
Many organisations try to scale agent adoption by enabling more chat surfaces or rolling out more licences. While usage increases, outcomes rarely do.
Without skills, scaling leads to inconsistency and risk. Agents amplify whatever they are given: clean, structured processes scale well; messy, undocumented ones scale badly.
That’s why scaling requires skilling. Before organisation-wide adoption, you need
- reusable patterns,
- ownership clarity,
- observability,
- and human-in-the-loop controls.
Otherwise, trust erodes quickly.
Domain experts are critical here. They are not just reviewers at the end, but co-builders of the skills agents rely on. This work must be iterative, because no one can fully predict how a process behaves until it is made explicit.
What does a realistic maturity path for agent adoption look like?
Successful adoption never starts with a large, end-to-end agent for a complex process. That approach almost always fails.
Instead, one capability is broken into smaller parts you can test and develop iteratively. Our team typically follows a simple cycle:
- discovery of how the process really works,
- hypothesis about what the agent should do next,
- validation with real cases,
- approval before expanding scope.
Short sprints and tight feedback loops are essential. Skeletons will come out of the closet: undocumented steps, unclear ownership, inconsistent execution. Treat this process as discovery, not failure.
How can you make agentic AI safer?
For end users, the goal is simple: they should be able to interact with AI safely. For IT Ops, safety comes from orchestration.
Process orchestration allows deterministic control where needed, dynamic agent behaviour where valuable, and human intervention where risk is high. It provides observability, auditability, and governance; the foundations that turn agentic AI from a demo into a dependable capability.
Where should you get started?
Start small, but deliberately.
- Choose one process with real pain and clear boundaries.
- Then ask what skills an agent would need to execute it reliably.
That exercise alone will highlight what needs to change: templates, ownership, documentation, or process clarity.
The success of Agentic AI doesn’t just depend on the technology you use, but on how your organisation matures with it. And the organisations that treat 2026 as the year of skilling — not just tooling — will be the ones that move beyond pilots and build lasting capability.
Want to move from AI pilots to governed, orchestrated agent skills that deliver measurable impact? If you’re unsure what it takes to scale safely, we can run a free audit for you — get in touch.
